
Exercises
I thought I might as well showcase some of the more exciting exercises that I have done. This is preparation for the certifications. OBS this is only to learn, these are no complete objects.
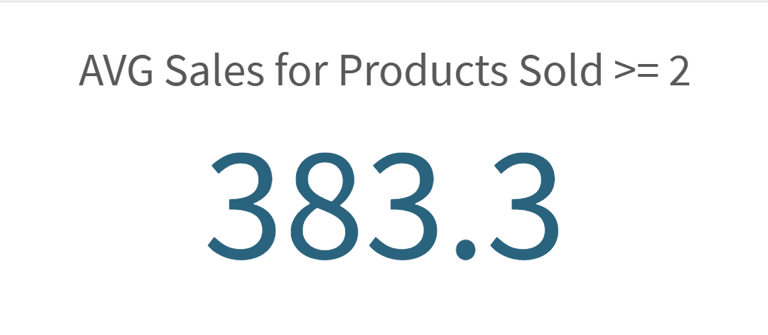
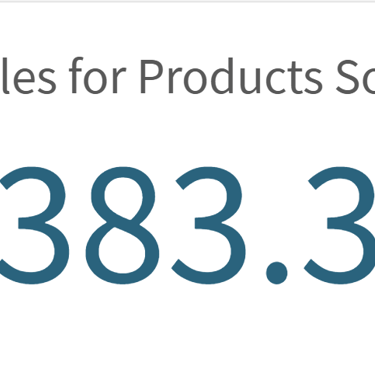
AVG Sales For Specific Products
Show average sales per product, but only for products that have at least 2 sales entries
Measure:
Avg(Aggr(If(Count(Sales) >= 2, Avg(Sales)),Product))
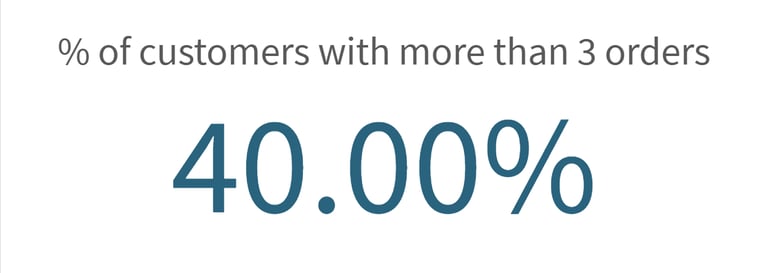
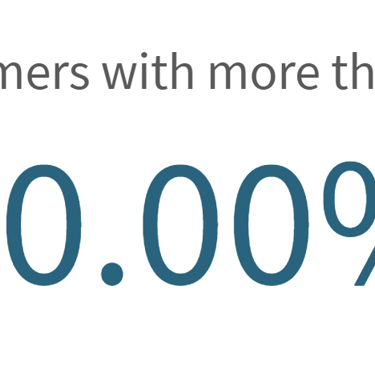
Customer With More Than 3 Orders
We checks if the order count per customer is greater than 3. Then count how many customers meet that rule. Lastly divides by total distinct customers.
Measure:
Num(Count(DISTINCT Aggr(If(Count(OrderID) > 3, CustomerID),CustomerID)) / Count(DISTINCT CustomerID),'#.##%')
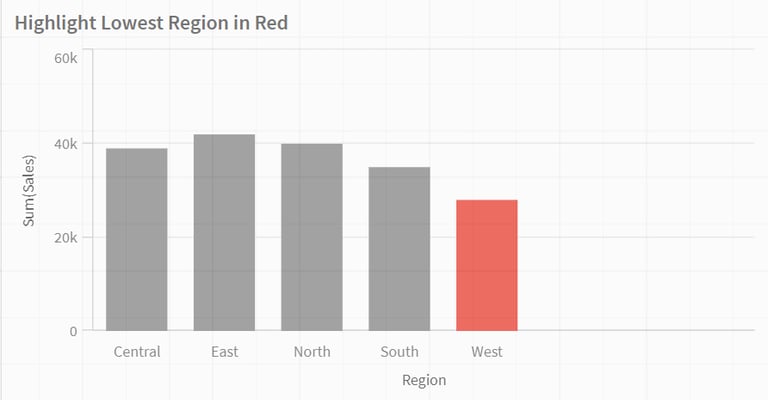
Coloring Through Expression
This highlights only the region with lowest sales in red, others in gray
Color by Expression:
If(Sum(Sales) = Min(TOTAL Aggr(Sum(Sales), Region)),'red','gray')
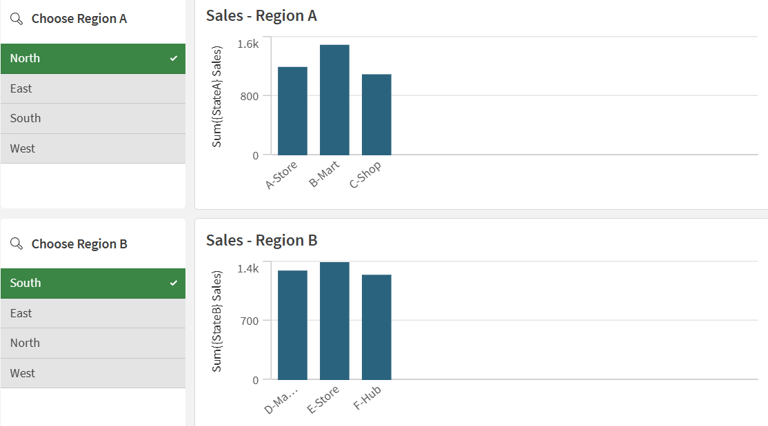
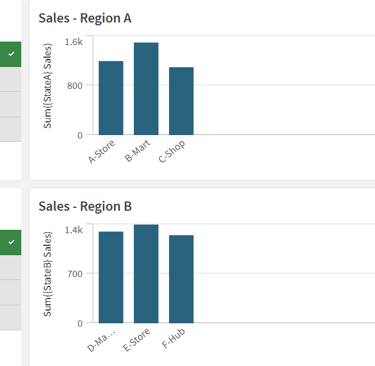
Alternative States
This exercise was a fail but I think that the alternative state function shows promise. There are no hard expressions in this exercise, however there are master item states to assign and take into account. I prefere variable or container...
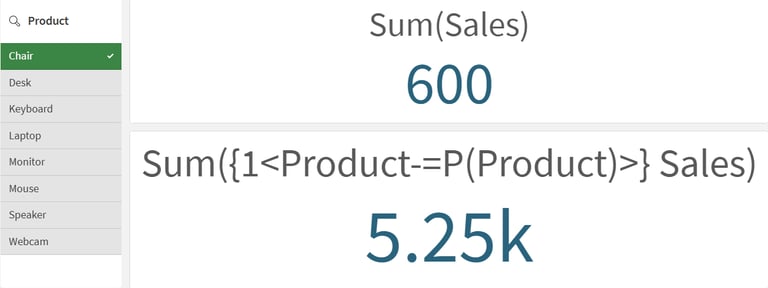
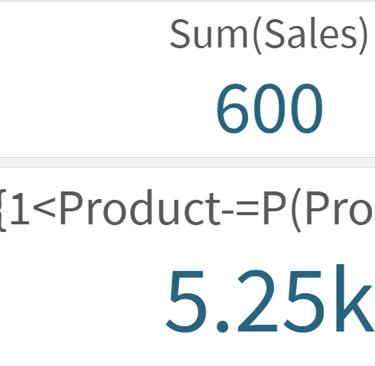
Exclude Selected Products from KPI
The first KPI shows the selected product's sales and in the second we exclude sales of each product when filtering.
Measure:
Sum({1<Product-=P(Product)>} Sales)
Level 3
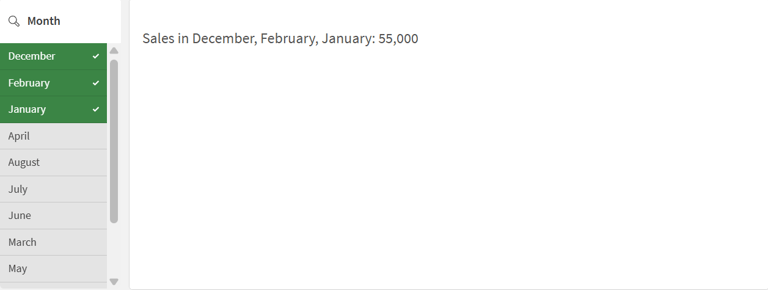
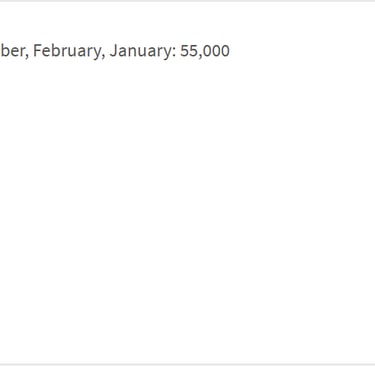
Dynamic Commentary Text Object
This concatenates the text with the selected Month and Sales.
Measure:
='Sales in ' & GetFieldSelections(Month) & ': ' & Num(Sum(Sales), '#,##0')
AVG Sales For Specific Products
Show average sales per product, but only for products that have at least 2 sales entries
Measure:
Avg(Aggr(If(Count(Sales) >= 2, Avg(Sales)),Product))
Customer With More Than 3 Orders
We checks if the order count per customer is greater than 3. Then count how many customers meet that rule. Lastly divides by total distinct customers.
Measure:
Num(Count(DISTINCT Aggr(If(Count(OrderID) > 3, CustomerID),CustomerID)) / Count(DISTINCT CustomerID),'#.##%')
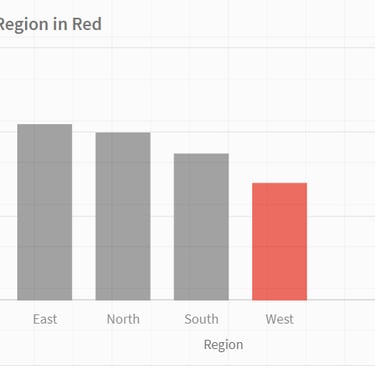
Coloring Through Expression
This highlights only the region with lowest sales in red, others in gray
Color by Expression:
If(Sum(Sales) = Min(TOTAL Aggr(Sum(Sales), Region)),'red','gray')
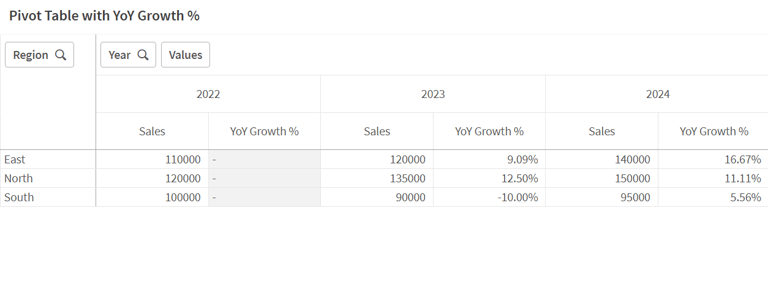
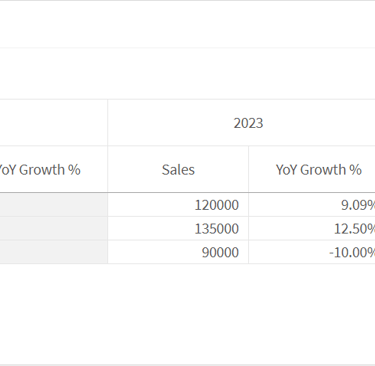
Pivot Table with YoY Growth %
First year will be blank (no prior year to compare). I like the pivot table over the straight one as this is more effective. Found that we had to use Before instead of Above...
Measure:
Num((Sum(Sales) - Before(Sum(Sales))) / Before(Sum(Sales)),'#.##%')
Exclude Selected Products from KPI
The first KPI shows the selected product's sales and in the second we exclude sales of each product when filtering.
Measure:
Sum({1<Product-=P(Product)>} Sales)
Level 2
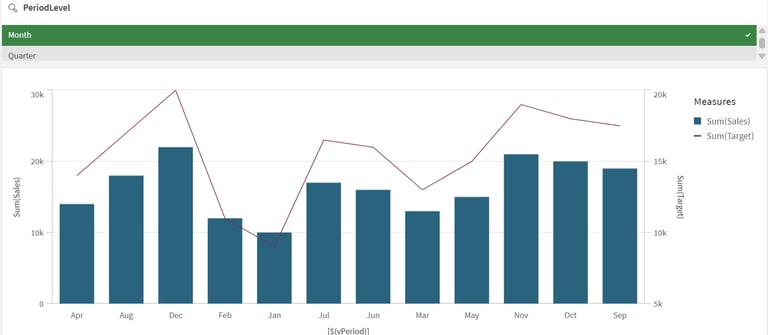
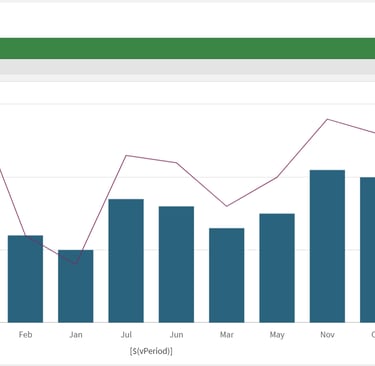
Combo Chart with Variable
Toggle between monthly and quarterly view using a field called PeriodLevel. This was learnt in order to use a variable to change dimension.
Variable:
Pick(Match(GetFieldSelections(PeriodLevel, ',', 1), 'Month', 'Quarter'), 'Month', 'Quarter' )
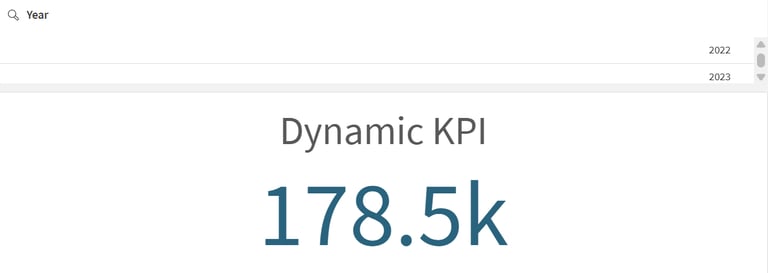
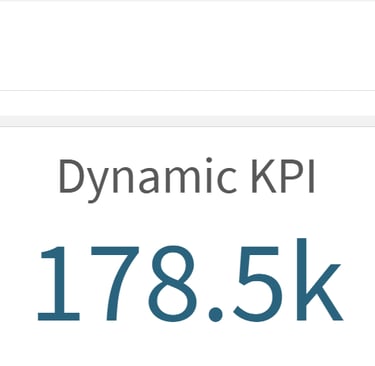
Dynamic KPI
Very easy but effective KPI. If the user selects one year, show sales for that year. If the user selects no year, default to latest year.
Measure:
If(GetSelectedCount(Year)=1, Sum(Sales), Sum({<Year={"$(=Max(Year))"}>} Sales))
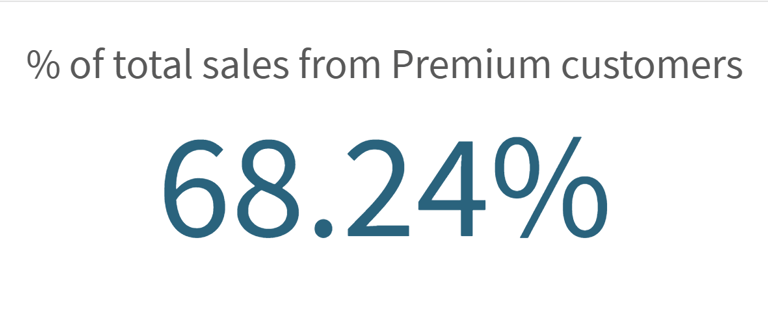
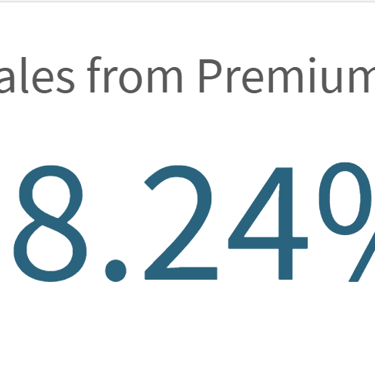
Dynamic KPI
This will show % of total sales from Premium customers
Measure:
Num(Sum({<CustomerType={'Premium'}>} Sales) / Sum(TOTAL Sales),'#.##%')
Dynamic Dimension
If one year is selected, then we show Month. If multiple or no years selected, then we show Years.
Dimension:
If(GetSelectedCount(Year) = 1, MonthName, Year)
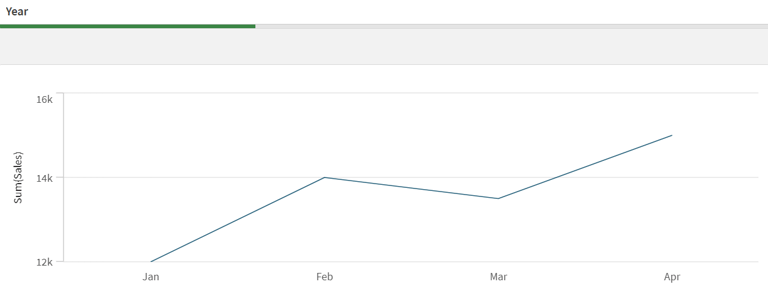
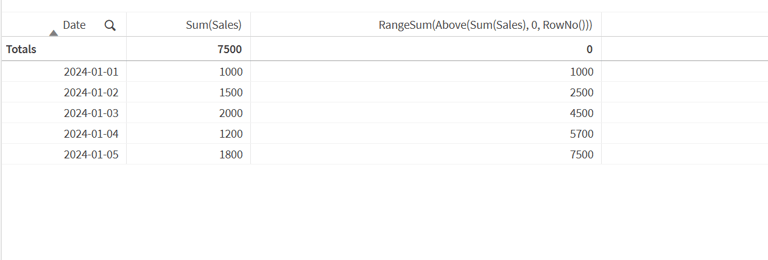
Cumulative Sales
Again, simple but effective.
Measure:
RangeSum(Above(Sum(Sales), 0, RowNo()))
Level 1
Kontakta mig


Email: max@clickcpace.se
Phone: +46(0)793 37 82 82