
My Projects
Below you find some of my projects.
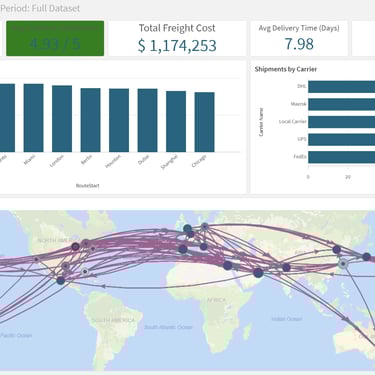
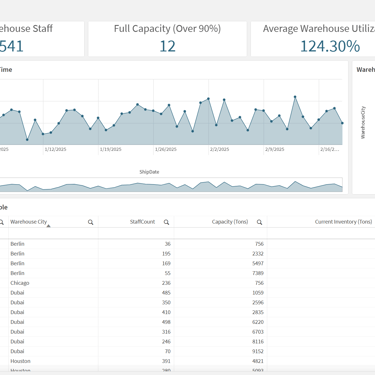
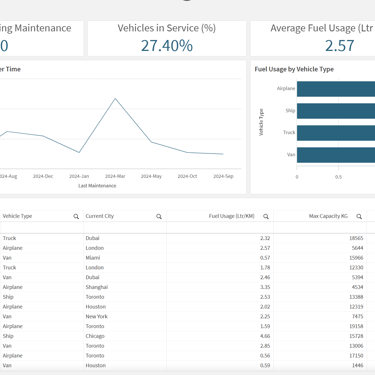
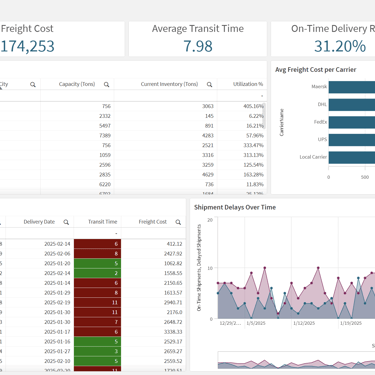
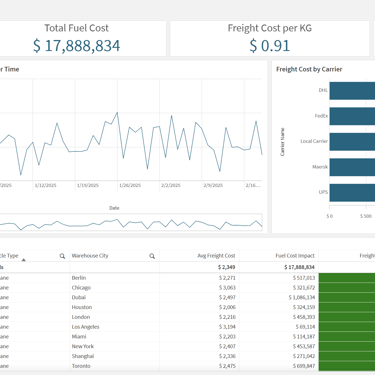
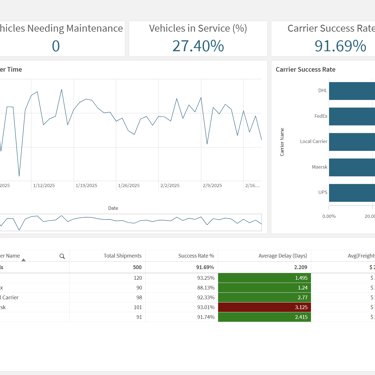
Logistics
One of my first Qlik Sense projects — included here to show the learning journey and difficulty progression.
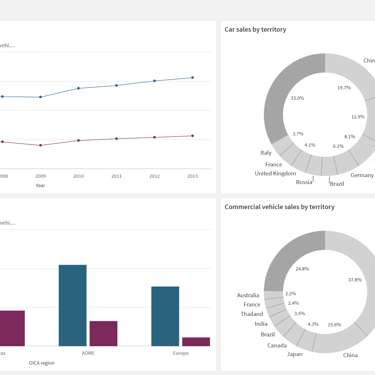
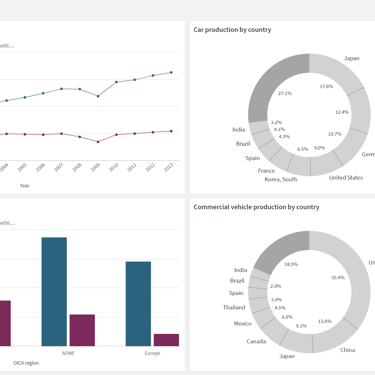
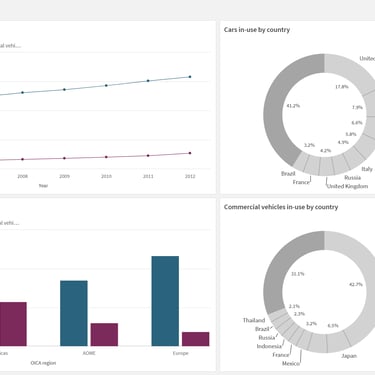
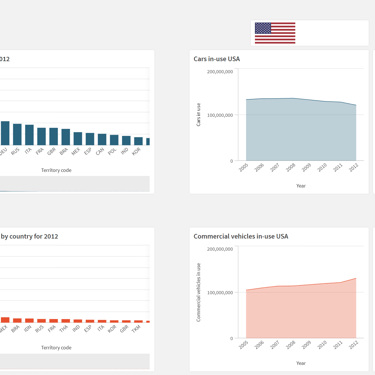
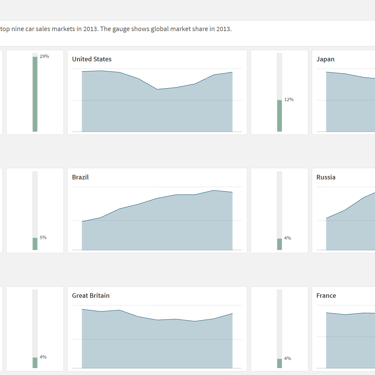
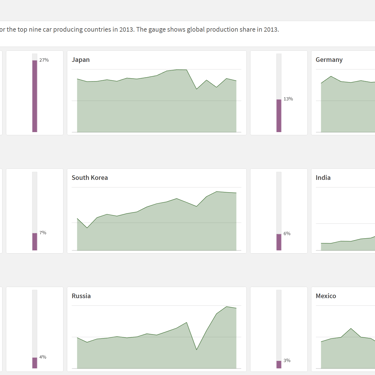
Automotive Sales
This application explores global trends in car and commercial vehicle sales, production, and in-use statistics from 1997 to 2013. It includes:
Year-over-year trends and regional breakdowns
Market share by country and vehicle type
Interactive gauges and donut charts
Detailed dashboards for top countries
Built to demonstrate advanced Qlik Sense dashboard design and data storytelling for large-scale datasets.
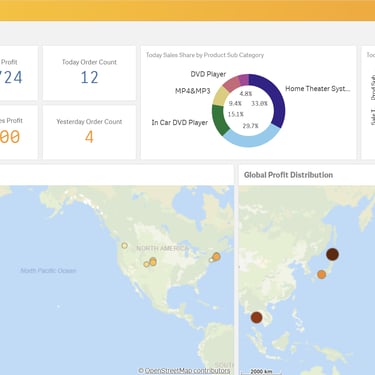
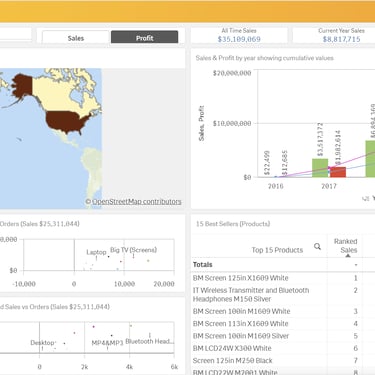
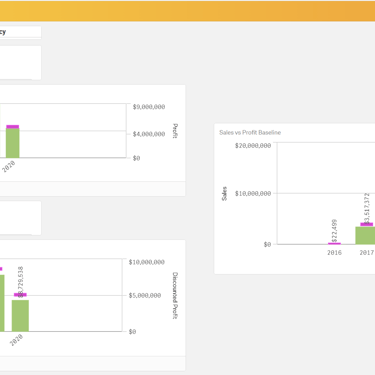
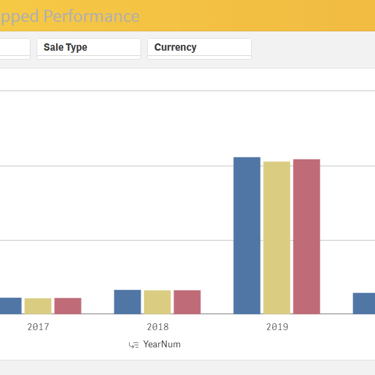
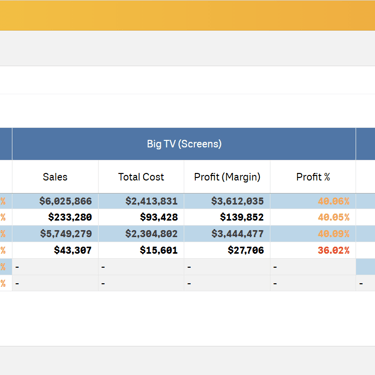
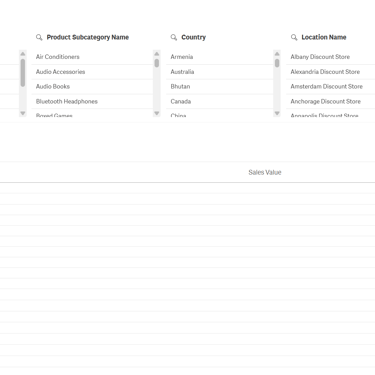
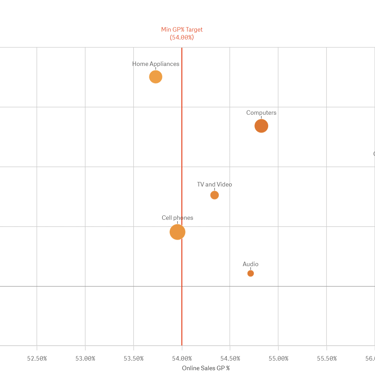
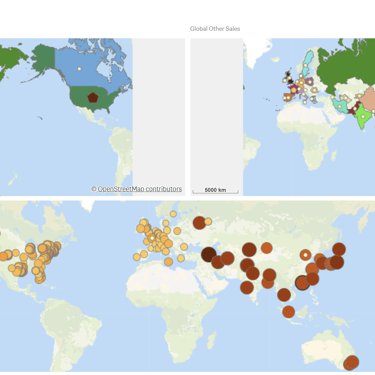
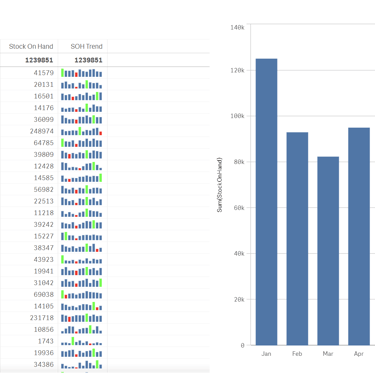
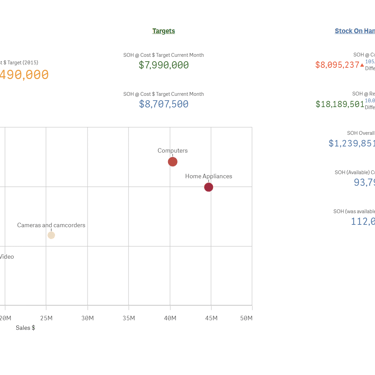
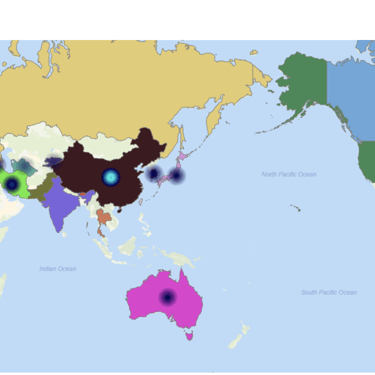
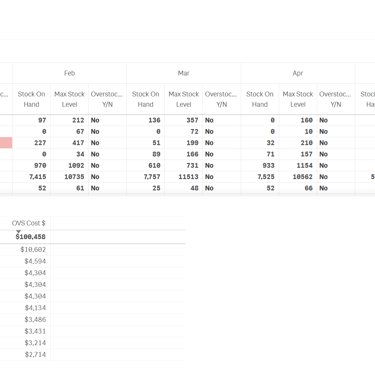
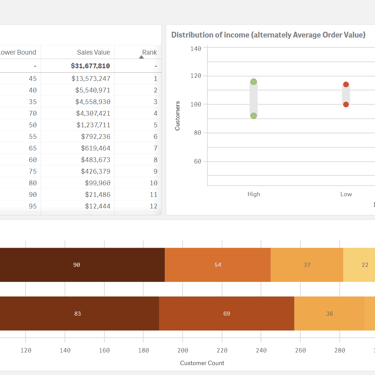
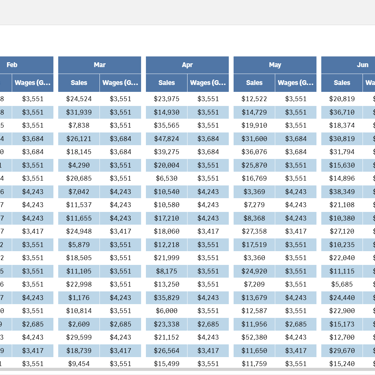
This interactive Qlik Sense application was developed as part of the Qlik Sense Certification – The Complete Practical Course on Udemy. It showcases a wide range of core BI and scripting concepts by analyzing eCommerce sales, profit, inventory levels, and market distribution.
Key highlights:
Multiple dashboards using KPIs, maps, comparative analysis, and alternate states
Advanced scripting techniques: Join, IntervalMatch, Crosstable, FirstSortedValue, Rank, incremental loads, SCD
Geo analytics and custom visualizations using the Qlik Visualization Bundle
Data validation, canonical calendar integration, and technical layout planning
This project reflects my ability to build scalable, visually clear Qlik Sense apps based on real-world business requirements.
E-commerce (Certification)
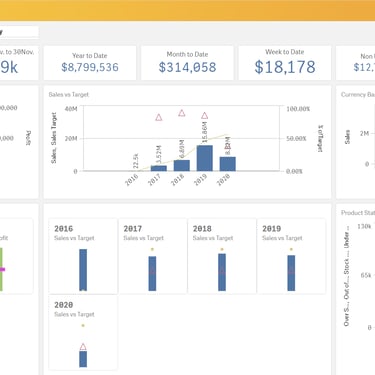
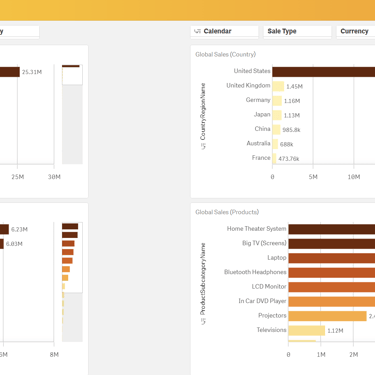
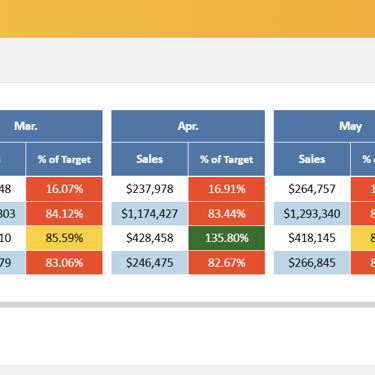
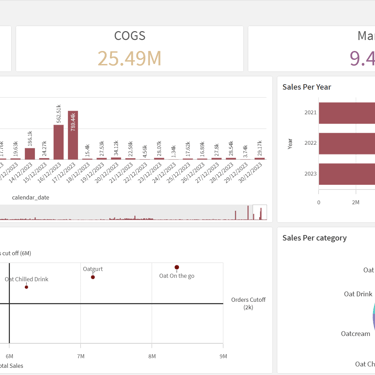
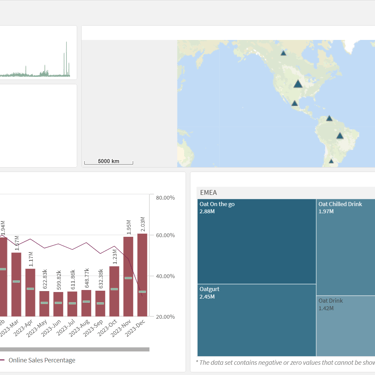
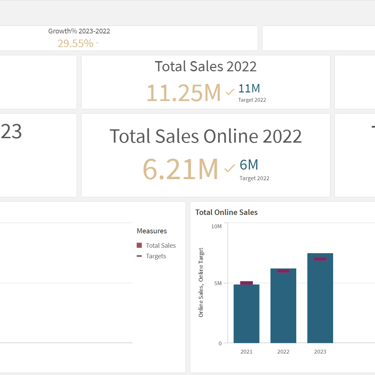
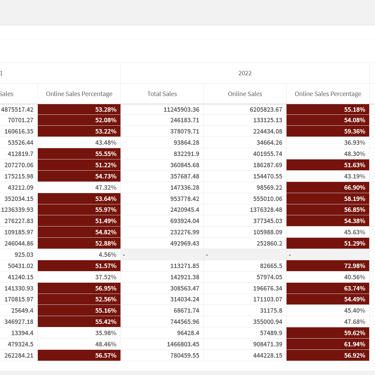
Oat Products Sales
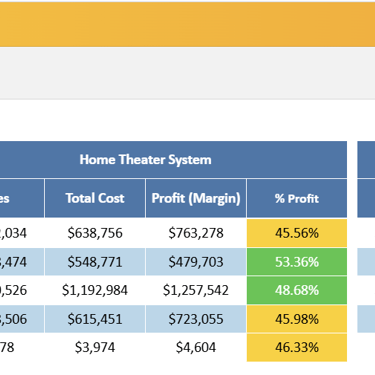
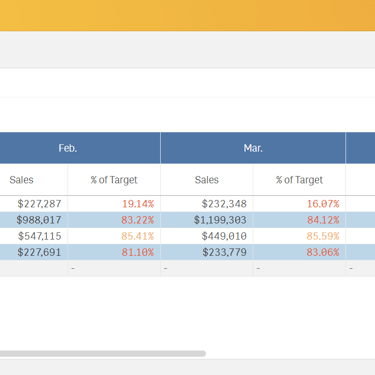
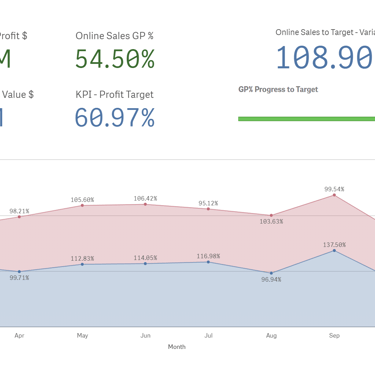
This application was built in a hands-on Qlik Sense course and displays sales, margins, and online shares over time. It includes:
Targets vs. actual outcomes
Pivot tables by country and category
Growth percentages and online distribution
Geo-analysis and tree maps
A complete example of data visualization for e-commerce in Qlik Sense.
Hospital
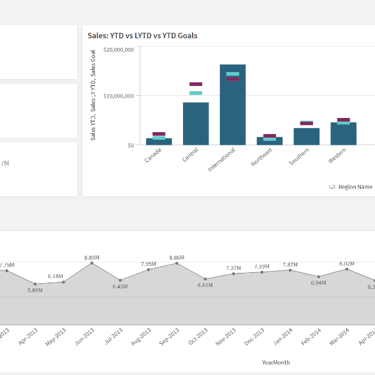
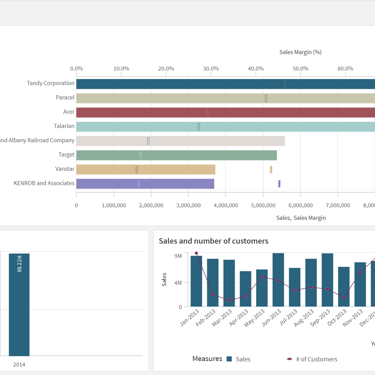
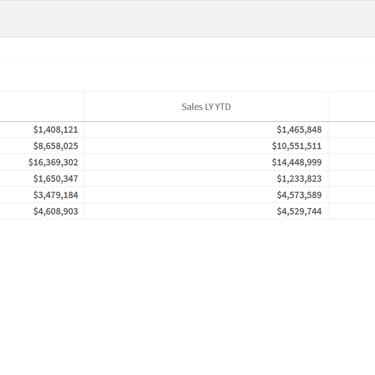
Business Insights
A business-focused Qlik Sense app with various dashboards and KPIs.
Includes YTD vs LYTD comparisons
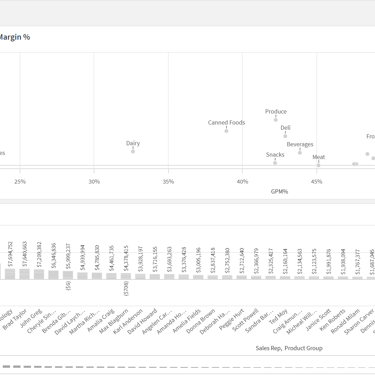
Margin and goal performance tracking
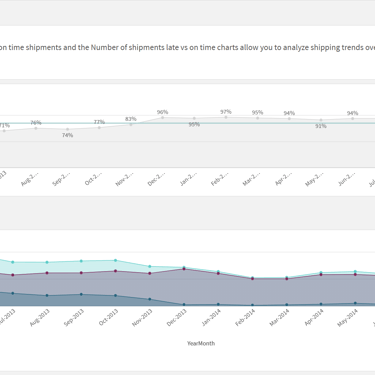
Shipment trends and delivery analysis
Sales rep breakdowns by product and profit
Customer sales and margin insights
Each sheet is designed to offer quick, interactive insights into business performance.
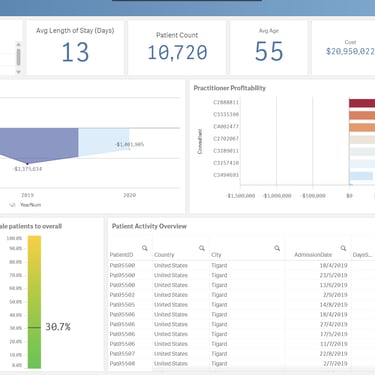
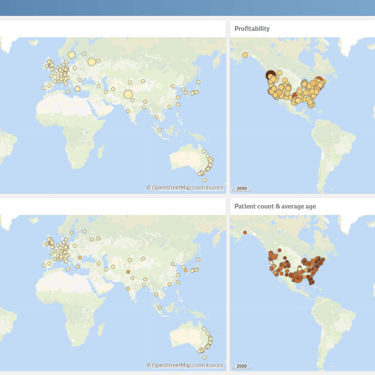
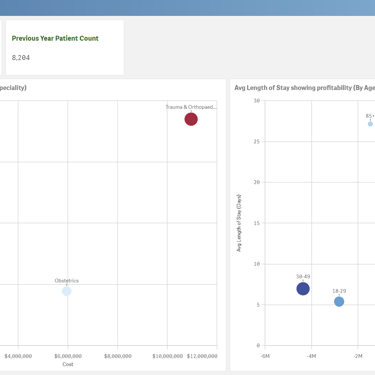
This app is focused on analyzing hospital operations, patient behavior, and financial outcomes.
Provides CEO-level KPIs such as average length of stay, total costs, and patient volume.
Includes profitability tracking over time and by practitioner.
Uses geo analytics to analyze cost, profitability, and patient distribution by region.
Highlights patient behavior based on age group and medical specialty.
Allows deep filtering by gender, year, and specialty for better decision support.
Designed to support strategic decisions in a healthcare setting.
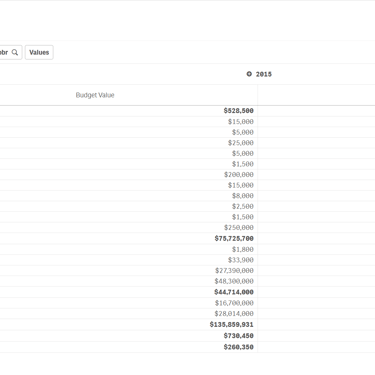
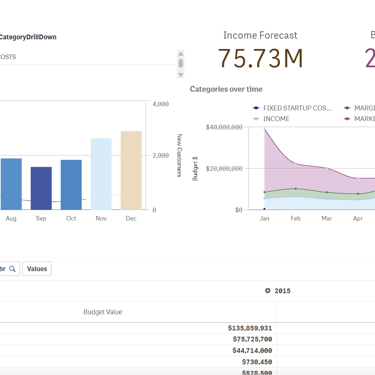
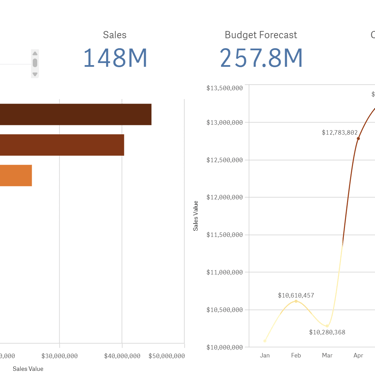
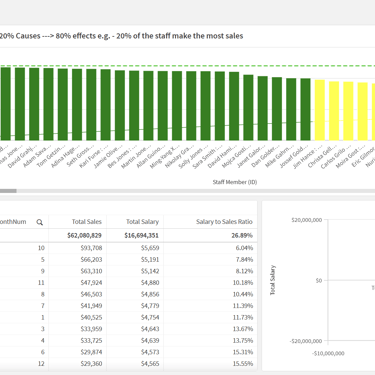
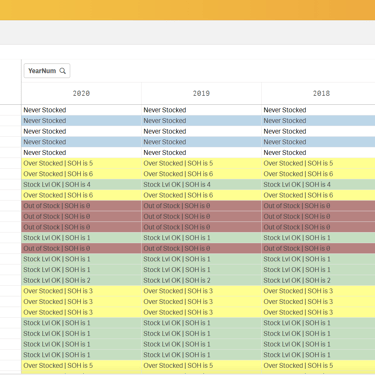
This Qlik Sense app is part of the Certificate in Qlik Sense Analytics Development and showcases a full analytics solution for a startup business. It covers budgeting, sales performance, stock levels, payroll, and customer insights through interactive dashboards.
Build KPIs, metrics, and dashboards based on real business needs
Design data models and resolve issues like synthetic keys
Apply set analysis and advanced expressions
Use geo-analytics, profitability tracking, and variance analysis
This hands-on app helps you develop real skills in data visualization, BI development, and Qlik scripting—preparing you for a role in analytics and business intelligence.
Startup (Certification)
Kontakta mig


Email: max@clickcpace.se
Phone: +46(0)793 37 82 82